

United Airlines (UAL): Sky High Ambitions, Mile-High Debt ✈️
United Airlines represents a play on the continued growth of global air travel, with particular exposure to premium international routes.

Earnings Report | About StrataFinance | How to Read the Layers Chart
AI-written, human-approved. Read responsibly.
Be sure to check out the Airlines Industry Guide coming later this week!
The Bottom Line Upfront 🎯
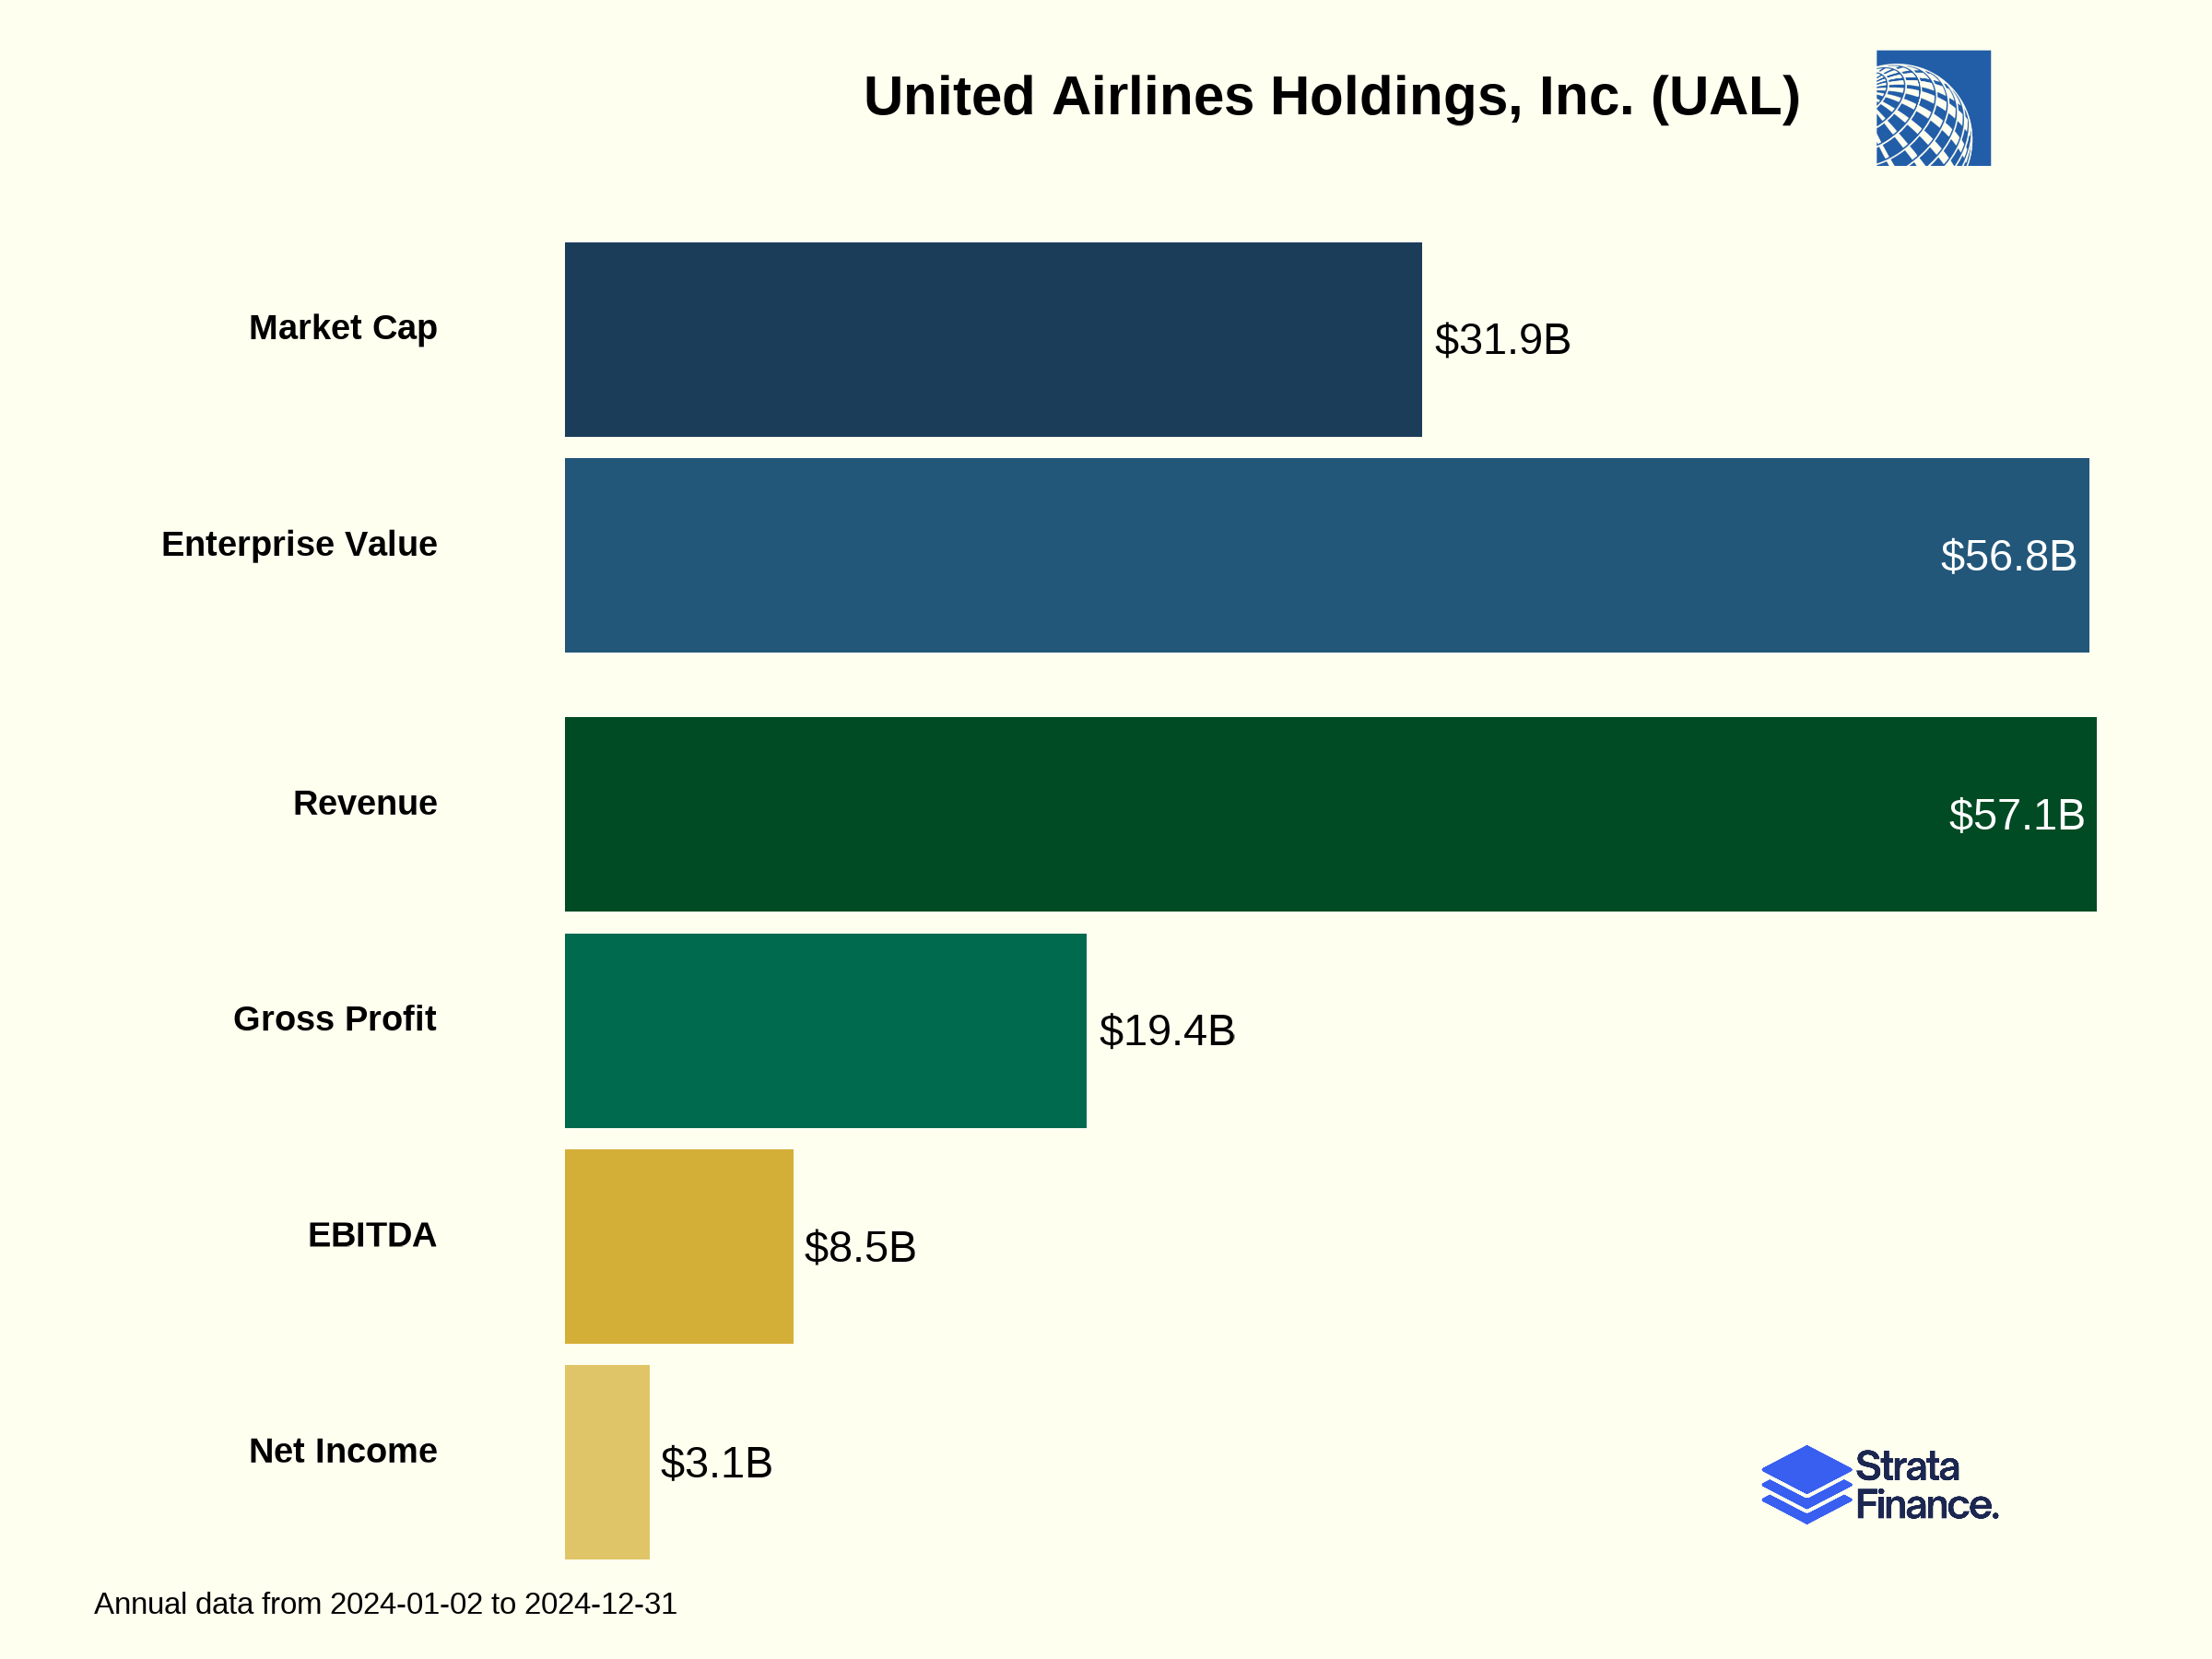
United Airlines operates the world’s largest airline by available seat miles, transporting 174 million passengers annually through its hub-and-spoke system. The company generates 91% of its $57.1 billion revenue from passenger services, with additional income from cargo, loyalty programs, and ancillary services. United’s competitive advantages include its global network, Star Alliance membership, and strategic hub locations. The airline is executing an ambitious “United Next” expansion plan, including 660 new aircraft by 2033. While United has improved profitability with an 8.9% operating margin in 2024, it faces challenges from labor costs, fuel price volatility, and intense competition. Investors should watch key metrics like PRASM, CASM, and debt ratios to gauge United’s ability to maintain profitability through economic cycles.

Layer 1: The Business Model 🏛️
Flying People Around
United Airlines is essentially a massive people-moving operation that happens to take place 35,000 feet in the air. Think of it as a bus system, but one that crosses oceans and continents while serving mediocre chicken dinners. As the largest airline in the world by available seat miles (ASMs), United transported a whopping 174 million passengers to over 360 destinations across six continents in 2024.
The company operates through a “hub-and-spoke” system with seven major U.S. hubs:
Chicago O’Hare (ORD)
Denver (DEN)
Houston (IAH)
Los Angeles (LAX)
New York/Newark (EWR)
San Francisco (SFO)
Washington Dulles (IAD)
This hub system is like a series of busy roundabouts that connect highways—passengers flow through central points before reaching their final destinations. This allows United to serve many more city pairs than would be possible with direct flights alone. For example, instead of needing separate planes for Peoria-to-Portland, Peoria-to-Phoenix, and Peoria-to-Pittsburgh routes, passengers from Peoria can all fly to Chicago and then connect to their various destinations.
Revenue Streams
United makes money through four main channels:
Passenger Revenue ($51.8 billion, 91% of total revenue ↗️): The bread and butter—selling seats on planes. This includes everything from basic economy tickets (where you might need to fight for overhead bin space) to luxurious Polaris business class pods (where flight attendants know your name and champagne preferences).
Cargo Revenue ($1.7 billion, 3% of total revenue ↗️): All that stuff in the belly of the plane that isn’t your lost luggage. United transports freight and mail across its global network.
MileagePlus Loyalty Program: United’s frequent flyer program is a money-printing machine. The company sells miles to partners (especially Chase for its co-branded credit cards), and customers redeem them for flights and other rewards. In 2024, approximately 9.2 million flight awards were used, representing about 9% of United’s total revenue passenger miles.
Other Revenue ($3.5 billion, 6% of total revenue ↗️): This includes maintenance services for other airlines, flight academy training, and ground handling services.
Key Performance Metrics 📊
United obsesses over these numbers:
Available Seat Miles (ASMs): 311.2 billion in 2024 ↗️ (up 6.8% from 2023)
Revenue Passenger Miles (RPMs): 258.5 billion in 2024 ↗️ (up 5.8% from 2023)
Passenger Load Factor: 83.1% in 2024 ↘️ (down from 83.9% in 2023)
Passenger Revenue per Available Seat Mile (PRASM): 16.66 cents in 2024 ↘️
Cost per Available Seat Mile (CASM): 16.70 cents in 2024 ↘️
If PRASM exceeds CASM, United makes money. If not… well, let’s just say the shareholders won’t be happy.
Layer 2: Category Position 🏆
The Airline Hunger Games
The airline industry is brutally competitive—imagine a gladiator arena where everyone has the same weapons but different colored uniforms. United battles several types of competitors:
Legacy Carriers: American Airlines and Delta Air Lines operate similar hub-and-spoke networks with comparable international reach. These are United’s main rivals in the fight for premium and business travelers.
Low-Cost Carriers: Southwest, JetBlue, and ultra-low-cost carriers like Spirit and Frontier compete primarily on price. They’re the Walmart to United’s Target—fewer frills but often lower prices.
International Heavyweights: Foreign carriers like Emirates, Qatar Airways, and Singapore Airlines compete for international travelers, often with government backing that makes United executives grind their teeth at night.
United’s Competitive Advantages
United has carved out a strong position through several key advantages:
Global Network: United’s extensive route network is a major competitive advantage, particularly for business travelers who need to reach multiple destinations. The airline serves more destinations than any other U.S. carrier.
Star Alliance Membership: United is part of Star Alliance, the world’s largest airline alliance with 26 member airlines serving over 1,200 airports in 195 countries. This gives United passengers access to a vast global network beyond what United itself flies.
Strategic Hub Locations: United’s hubs are in major business centers and international gateways, giving it a strong positioning for both domestic and international traffic.
Joint Business Arrangements: United participates in four-passenger JBAs covering transatlantic routes, certain transpacific routes, routes between the U.S. and New Zealand, and certain U.S.-Canada transborder routes. These arrangements allow United to coordinate schedules and pricing with partner airlines, enhancing its competitive position.
Recent Market Developments
United has been aggressively expanding through its “United Next” plan, which includes:
Taking delivery of over 660 new aircraft by 2033
Increasing employee headcount by more than 30,000 since 2020
Expanding to new international destinations like Ulaanbaatar, Mongolia; Nuuk, Greenland; and Dakar, Senegal
Launching Kinective Media℠, a personalized advertising network
This expansion has allowed United to gain market share, particularly in international markets, where it saw Pacific revenue grow by 20.1% in 2024. However, the airline industry remains highly susceptible to external shocks, and United’s ambitious growth plans could be derailed by factors beyond its control.
Layer 3: Show Me The Money! 📈
Revenue Breakdown by Geography
United’s $57.1 billion in 2024 revenue (↗️ 6.2% from 2023) comes from across the globe:
Domestic (U.S. and Canada): $34.1 billion (60% of total) ↗️ 4.4%
Atlantic: $11.1 billion (19% of total) ↗️ 1.9%
Pacific: $6.5 billion (11% of total) ↗️ 20.1%
Latin America: $5.4 billion (10% of total) ↗️ 7.2%
The Pacific region saw the strongest growth as post-pandemic travel to Asia rebounded. This geographic diversification helps United weather regional economic downturns—when business is slow in one part of the world, another region might be booming.
Passenger Revenue Components
United’s passenger revenue isn’t just about basic ticket prices:
Base Fares: The core ticket price for transportation.
Ancillary Services: Fees for everything from checked bags to preferred seating generated $4.5 billion in 2024 ↗️. These are highly profitable revenue streams that have become increasingly important to airlines. (Remember when checking a bag was free? Pepperidge Farm remembers.)
Premium Cabin Revenue: Business and first-class tickets generate significantly higher yields than economy seats. United has been investing heavily in its premium offerings, including Polaris business class and Premium Plus premium economy.
The MileagePlus Money Machine
United’s MileagePlus program is a goldmine. The program works like this:
Mile Sales: United sells miles to partners, particularly Chase for its co-branded credit cards. These sales are highly profitable.
Mile Redemptions: Members redeem miles for flights (93% of redemptions) and non-travel awards (7%).
The beauty of this model is that United gets paid upfront when selling miles to partners but only incurs costs when miles are redeemed—which might be years later, if at all. In 2024, United recognized $3.6 billion in revenue from miles earned by members.
Growth Drivers and Headwinds
Growth Drivers:
International expansion, particularly in the Pacific region
Premium cabin growth through product improvements
Ancillary revenue opportunities
Fleet modernization improving fuel efficiency and customer experience
Headwinds:
Intense price competition in domestic markets
Rising labor costs (82% of employees are unionized)
Aircraft delivery delays affecting growth plans
Geopolitical disruptions impacting international routes
Seasonality Factors
The airline industry is highly seasonal, with demand typically higher in the second and third quarters (spring and summer) than in the first and fourth quarters (fall and winter). This pattern affects United’s quarterly results, with Q2 and Q3 generally being the strongest periods for revenue and profitability.
Layer 4: Cash Rules Everything Around Me 💰
Profitability Trends
United’s profitability has been improving:
Operating income: $5.1 billion in 2024 ↗️ (up from $4.2 billion in 2023)
Net income: $3.1 billion in 2024 ↗️ (up from $2.6 billion in 2023)
Operating margin: 8.9% in 2024 ↗️ (up from 7.8% in 2023)
These are solid numbers for an airline, an industry where margins are typically thinner than a coach class sandwich. The improvement reflects United’s ability to grow revenue while managing costs effectively.
Major Cost Categories 💸
United’s major operating expenses include:
Salaries and Related Costs: $16.7 billion (32% of operating expenses) ↗️ 12.8%
This reflects the labor-intensive nature of the airline industry and recent wage increases.
Aircraft Fuel: $11.8 billion (23% of operating expenses) ↘️ 7.1%
Fuel costs decreased despite increased consumption due to lower average prices per gallon.
Landing Fees and Other Rent: $3.4 billion (7% of operating expenses) ↗️ 11.7%
These costs increased due to rate increases at various airports and higher landed weight volume.
Aircraft Maintenance: $3.1 billion (6% of operating expenses) ↗️ 12.0%
Maintenance costs increased due to fleet growth and aging aircraft.
Regional Capacity Purchase: $2.5 billion (5% of operating expenses) ↗️ 4.8%
Payments to regional carriers operating under capacity purchase agreements.
Labor costs are rising faster than revenue, which is a concern for long-term profitability. However, United has been offsetting this through more efficient aircraft and operational improvements.
Balance Sheet Health
As of December 31, 2024, United had:
$14.5 billion in unrestricted cash, cash equivalents, and short-term investments ↗️
$33.6 billion in debt, finance lease, operating lease, and other financial liabilities
$3.9 billion in debt maturing in the next 12 months
United has been actively managing its debt, prepaying $3.9 billion of its 2021 term loan, $1.8 billion of its MileagePlus term loan, and $0.4 billion of its 2024 term loan during 2024. This debt reduction strategy helps strengthen the balance sheet and reduce interest expenses, which decreased by 16.7% in 2024.
Capital Allocation Priorities
United’s capital allocation priorities include:
Fleet Modernization: The company expects less than $7.0 billion in adjusted capital expenditures in 2025, primarily for new aircraft deliveries as part of the United Next plan.
Debt Reduction: United has been actively paying down debt to strengthen its balance sheet.
Share Repurchases: In October 2024, United announced a new share repurchase program allowing for purchases of up to $1.5 billion in outstanding UAL common stock and certain warrants.
Liquidity Maintenance: United maintains substantial liquidity to weather industry downturns and unexpected events.
United does not currently pay dividends and does not expect to do so in the foreseeable future, preferring to reinvest in the business and reduce debt.
Layer 5: What Do We Have to Believe? 📚
The Bull Case 🐂
For United to soar, you need to believe:
United Next Execution: The company will successfully take delivery of over 660 new aircraft by 2033, increasing efficiency and improving the customer experience. These new planes will drive down unit costs through better fuel efficiency and higher gauge (more seats per aircraft).
Premium Revenue Growth: United can continue to capture premium revenue through its Polaris business class and Premium Plus offerings, driving yield improvements. Business travel will fully recover and grow beyond pre-pandemic levels.
International Expansion: The company will successfully expand its international presence, particularly in high-growth markets in Asia and Latin America, where it saw strong growth in 2024.
Cost Control: United can manage its cost structure effectively, particularly labor costs (with 82% of employees unionized) and fuel expenses, maintaining or expanding margins.
MileagePlus Value: The loyalty program will continue to grow in value, with increasing partner revenue and customer engagement, providing a stable revenue stream even during economic downturns.
The Bear Case 🐻
But beware of these turbulent risks:
Fuel Price Volatility: United doesn’t hedge fuel prices, making it vulnerable to price spikes. A significant increase in fuel costs could quickly erode profitability.
Labor Relations: With 82% of employees unionized and recent wage increases, labor costs could continue to rise faster than revenue, squeezing margins.
Competitive Pressures: Intense competition from both domestic and international carriers could limit pricing power and market share gains.
Economic Sensitivity: Airlines are highly cyclical businesses. An economic downturn could rapidly reduce demand for air travel, particularly in premium cabins where United has been investing.
Aircraft Delivery Delays: United’s growth plans depend on timely aircraft deliveries, which have been subject to delays due to manufacturing issues at Boeing and supply chain constraints.
Geopolitical Disruptions: International conflicts have already impacted United’s routes and could continue to disrupt operations. The suspension of overflying in Russian airspace due to the Russia-Ukraine conflict has affected routes to Asia.
Key Metrics to Watch 👀
Passenger Revenue per Available Seat Mile (PRASM): This measures United’s ability to generate revenue from each seat mile flown. Improvements indicate pricing power and effective revenue management.
Cost per Available Seat Mile (CASM): This measures United’s cost efficiency. Keeping CASM growth below PRASM growth is essential for expanding margins.
Debt-to-EBITDA Ratio: This indicates United’s financial leverage. Continued reduction would strengthen the balance sheet and provide flexibility for future investments or downturns.
On-Time Performance and Customer Satisfaction: These operational metrics affect United’s ability to attract and retain high-value customers.
Aircraft Delivery Schedule: Any delays could impact United’s growth plans and cost reduction targets.
The Final Boarding Call ✈️
United Airlines represents a play on the continued growth of global air travel, with particular exposure to premium international routes. The company’s extensive network, strong loyalty program, and fleet modernization strategy position it well to capture market share and improve profitability.
However, airlines remain cyclical businesses with thin margins and significant external risks. United’s success depends on executing its United Next plan while maintaining cost discipline in a highly competitive industry. The company has made impressive progress since the pandemic but still faces challenges from labor costs, fuel price volatility, and potential economic headwinds.
For investors considering United, the key question is whether the company’s network advantages and operational improvements can drive sustainable profitability through economic cycles. If you believe in the long-term growth of global air travel and United’s ability to capture a premium position in that market, the stock offers an interesting opportunity—just be prepared for some turbulence along the way.
As they say in the airline business: “In good times, we make a little money. In bad times, we lose a lot.” United is working to change that equation, but the jury is still out on whether they’ll succeed in the long run.
Disclaimer: This guide is for informational purposes only and does not constitute financial advice, investment recommendations, or an offer or solicitation to buy or sell any securities. The information contained in this report has been obtained from sources believed to be reliable, but StrataFinance does not guarantee its accuracy, completeness, or timeliness.