

American Airlines: Flying High with Debt and Loyalty Miles 👨✈️
American represents a leveraged bet on continued strong travel demand and industry capacity discipline.

Earnings Report | About StrataFinance | How to Read the Layers Chart
AI-written, human-approved. Read responsibly.
The Bottom Line Upfront 🎯
American Airlines Group operates one of the world's largest airline networks with a hub-and-spoke model connecting 350+ destinations. While the core airline business faces thin margins and high fixed costs, the AAdvantage loyalty program is the crown jewel, generating substantial high-margin revenue. Despite progress in debt reduction, AAL still carries a heavier debt burden than competitors, making it more vulnerable during economic downturns. The company represents a leveraged bet on continued strong travel demand, likely to outperform during expansions but face greater risks during contractions compared to less-leveraged rivals.

Layer 1: The Business Model 🏛️
Flying People and Packages ✈️
American Airlines Group (AAL) is essentially a massive transportation network that moves people and cargo around the world. Think of it as the Uber of the skies, but with much bigger vehicles and significantly more complimentary pretzels.
At its core, AAL operates 977 mainline aircraft (the big planes) and coordinates another 585 regional aircraft (the smaller ones that make you crouch while boarding) to connect over 350 destinations worldwide. In 2024 alone, they transported more than 226 million passengers—that's roughly equivalent to moving the entire population of Indonesia from point A to point B.
Hub-and-Spoke: The Airline's Secret Sauce 🌐
Rather than offering direct flights between every possible city pair (which would be logistically impossible), American uses a hub-and-spoke model. Think of it like a bicycle wheel—all routes connect through central hubs:
Charlotte
Chicago
Dallas/Fort Worth (their largest hub)
Los Angeles
Miami
New York
Philadelphia
Phoenix
Washington, D.C.
This model allows them to funnel passengers from smaller markets through these hubs to reach their final destinations. It's efficient for the airline, but sometimes, it means you're flying north to eventually go south (we've all been there).
Revenue Streams: More Than Just Tickets 💵
American makes money through four primary channels:
Passenger Revenue ($49.6B in 2024, 91.5% of total): Tickets, bag fees, seat selection, and all those other little charges that mysteriously appear on your credit card.
Cargo Revenue ($804M in 2024, 1.5%): Moving freight and mail in the belly of passenger planes and dedicated cargo aircraft.
Loyalty Program ($7.1B in 2024, 13.1%): The AAdvantage program is a gold mine, generating revenue when members:
Redeem miles for flights ($3.8B)
Use co-branded credit cards and other partnerships ($3.3B)
Other Revenue ($564M in 2024, 1.0%): Airport clubs, commissions, and vacation packages.
The AAdvantage Money Machine 💳
The AAdvantage loyalty program deserves special attention because it's arguably more valuable than the airline itself. In 2024, co-branded credit card and partner payments totaled a whopping $6.1 billion ↗️ (up 17% from 2023).
American recently signed a 10-year deal with Citibank to be the exclusive issuer of AAdvantage credit cards starting in 2026, which included a substantial one-time payment. This program is so profitable because it essentially sells miles to banks at a much higher rate than what it costs American to provide the eventual free flights.
Key Performance Metrics ⚙️
American measures success through several key metrics:
Revenue Passenger Miles (RPMs): 248.8 billion in 2024 ↗️ (up 7.3%)
Available Seat Miles (ASMs): 292.9 billion in 2024 ↗️ (up 5.5%)
Passenger Load Factor: 84.9% in 2024 ↗️ (up 1.4 points)
Passenger Yield: 19.93 cents in 2024 ↘️ (down 4.7%)
Total Revenue per Available Seat Mile (TRASM): 18.51 cents in 2024 ↘️ (down 2.6%)
In plain English: They flew more people (higher load factor) on more flights (increased capacity), but at lower average fares (decreased yield). It's like filling more seats in a theater but having to discount the tickets to do so.
Layer 2: Category Position 🏆
The Competitive Skies 🥊
The airline industry is notoriously competitive, with razor-thin margins and high fixed costs. American Airlines competes in several distinct battlegrounds:
Major Network Carriers: Delta and United are American's primary full-service rivals. These three legacy carriers dominate the U.S. market with similar business models.
Low-Cost Carriers (LCCs): Southwest, JetBlue, and Alaska Airlines offer competitive domestic service with lower cost structures.
Ultra-Low-Cost Carriers (ULCCs): Frontier, Spirit, and Allegiant target extremely price-sensitive travelers with bare-bones service and à la carte fees. (Think paying for everything short of the oxygen mask demonstration.)
International Carriers: On global routes, American faces competition from foreign airlines that often have government support or lower labor costs.
Market Position: Strong But Mixed 📊
American holds significant market share in the U.S. domestic market, with particular strengths in:
Latin American Routes: Historically a powerhouse in Mexico, the Caribbean, and South America
Dallas/Fort Worth: Dominant position at its largest hub
Charlotte: Another fortress hub with limited competition
However, American faces challenges in:
Asia-Pacific Markets: Relatively weaker than Delta and United
Premium Business Travel: Generally perceived as lagging Delta in service quality
Cost Structure: Higher than some competitors, limiting pricing flexibility
Alliance Power: Friends in High Places 🤝
American extends its reach through strategic partnerships:
oneworld Alliance: As a founding member, American coordinates with 12 other global airlines including British Airways, Cathay Pacific, and Qatar Airways.
Joint Business Agreements: Revenue-sharing ventures covering:
Transatlantic (with British Airways, Iberia, etc.)
Transpacific (with Japan Airlines)
Australia/New Zealand (with Qantas)
These partnerships allow American to offer customers access to destinations it doesn't serve directly while sharing revenue with partner airlines. It's like having friends with vacation homes all over the world.
Recent Wins and Challenges 🎯
Wins:
Launched over 50 new routes in 2024
AAdvantage named "Best U.S. Airline Loyalty Program" by The Points Guy for second consecutive year
New 10-year exclusive agreement with Citibank for co-branded credit cards
Challenges:
Distribution strategy changes in 2024 contributed to booking softness
Terminated Northeast Alliance with JetBlue following antitrust action
Facing ongoing litigation related to the Northeast Alliance
Layer 3: Show Me The Money! 📈
Revenue Breakdown: Where's the Cash Coming From? 💸
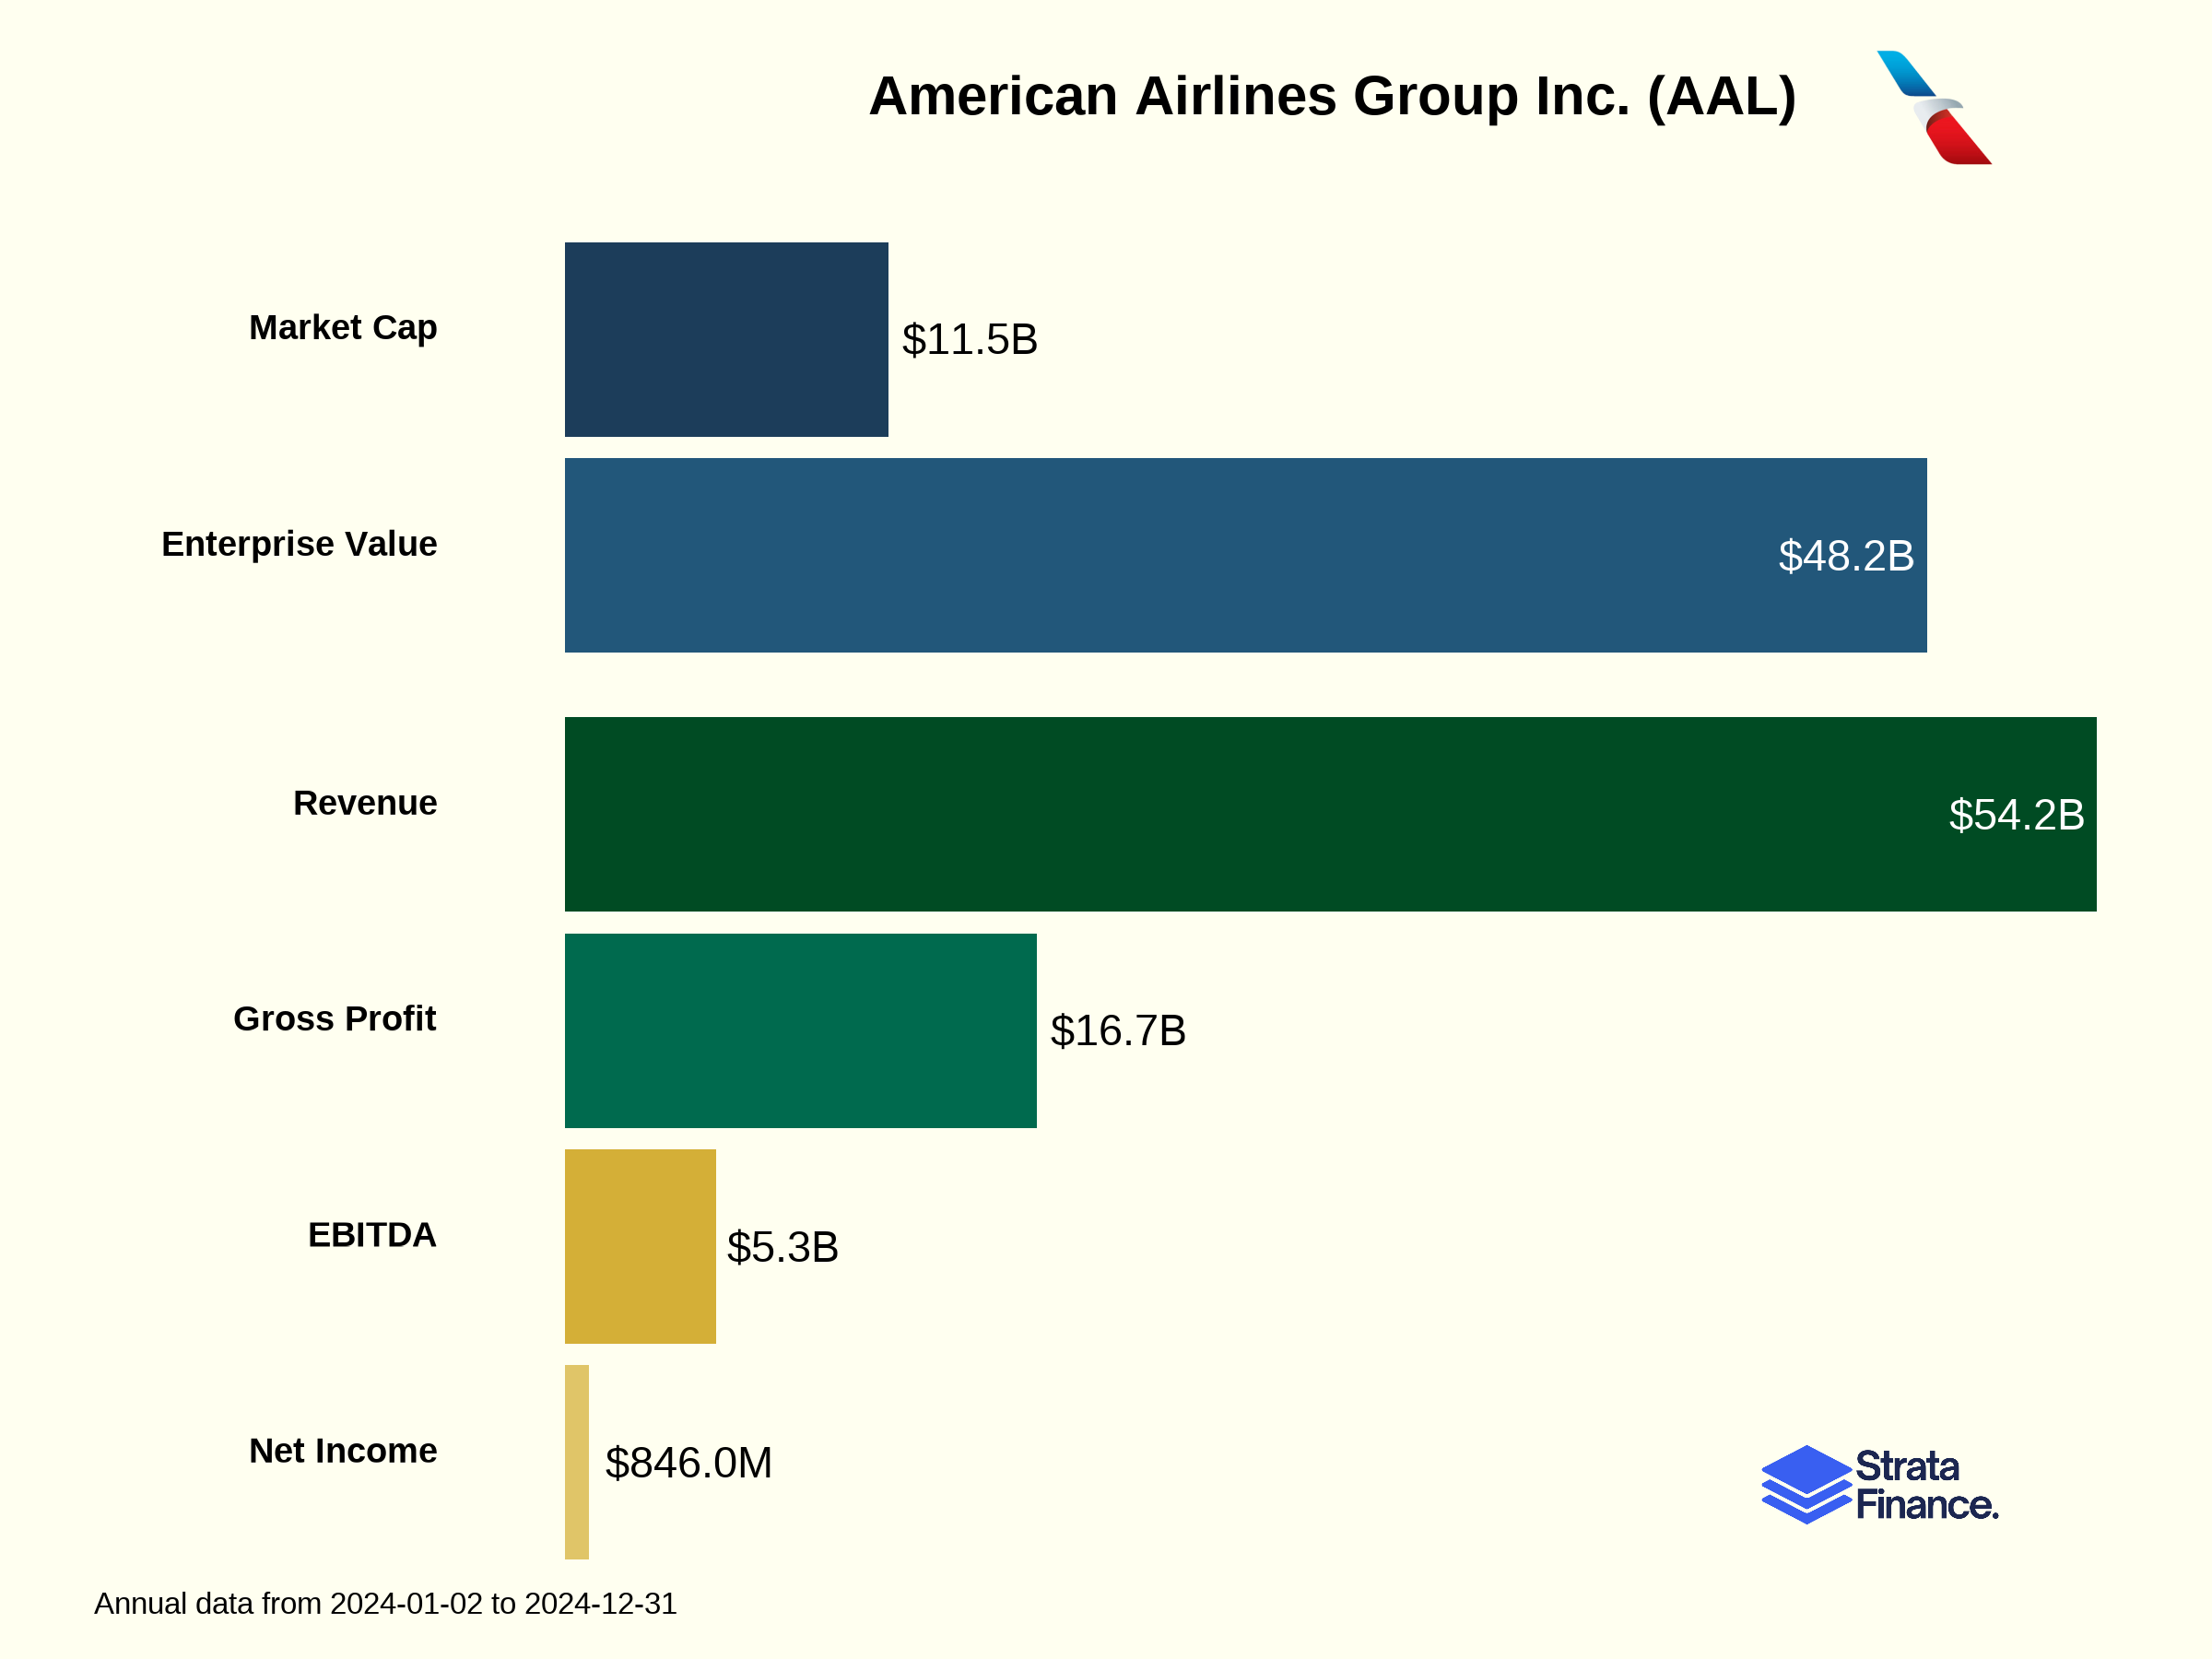
American's 2024 total operating revenue of $54.2 billion ↗️ (up 2.7% from 2023) breaks down as follows:
Passenger Revenue by Region ($49.6B total):
Domestic: $35.3B (71.2% of passenger revenue)
Latin America: $6.6B (13.2%)
Atlantic: $6.4B (13.0%)
Pacific: $1.2B (2.5%)
This geographic mix highlights American's strength in domestic and Latin American markets, with growing but still relatively small exposure to Pacific routes.
Growth Drivers and Headwinds 🌪️
Growth Drivers:
Loyalty Program: The AAdvantage program continues to be a star performer, with partner payments up 17% to $6.1B in 2024
International Expansion: Launched new routes to destinations like Tokyo, Brisbane, Copenhagen, and Nice
Premium Travel: Focus on higher-yield business and premium leisure travelers
Headwinds:
Yield Pressure: Passenger yield decreased 4.7% in 2024 despite capacity growth
Distribution Challenges: Changes to distribution strategy negatively impacted bookings
Industry Capacity: Over-supply of industry capacity, particularly in the first half of 2024
Seasonal Patterns: Summer Surge 🏖️
Like most airlines, American experiences significant seasonality:
Summer (Q2-Q3): Peak travel season with highest demand and yields
Winter (Q1-Q4): Weaker demand, especially in January/February
Holiday Periods: Spikes around Thanksgiving, Christmas, and spring break
As American notes in their filing: "Due to the greater demand for air travel during the summer months, revenues in the airline industry exhibit seasonal patterns." This is why you're paying premium prices for that July vacation but can find bargains in February.
Customer Mix: Business vs. Leisure 👔🏄
American doesn't explicitly break down business vs. leisure travel, but industry trends and their comments suggest:
Business Travel: Still recovering from pandemic shifts in corporate travel policies
Premium Leisure: Growing segment of leisure travelers willing to pay for premium experiences
Value-Conscious Travelers: Targeted with Basic Economy fares to compete with low-cost carriers
The company noted mid-year strategy adjustments in 2024 that, combined with industry capacity deceleration, "resulted in sequential year-over-year improvement in passenger unit revenue performance in the third and fourth quarters of 2024." In other words, things got better as the year progressed.
Layer 4: Cash Rules Everything Around Me 💰
Profitability: Mixed Results 📝
American's 2024 financial performance shows a mixed picture:
Operating Income: $2.6B ↘️ (down 13.9% from 2023)
Pre-tax Income: $1.2B ↗️ (up 2.9% from 2023)
Net Income: $846M ↗️ (up 2.9% from 2023)
Pre-tax Income (excluding special items): $1.8B ↘️ (down 26.0% from 2023)
The divergence between GAAP and non-GAAP results is primarily due to special items, including labor contract expenses related to new agreements with flight attendants and passenger service employees.
Margin Trends: Pressure Points 📉
American's margins faced pressure in 2024:
Operating Margin: 4.8% in 2024 ↘️ (down from 5.7% in 2023)
Pre-tax Margin: 2.1% in 2024 ↗️ (up slightly from 2.1% in 2023)
Net Margin: 1.6% in 2024 ↗️ (up slightly from 1.6% in 2023)
These thin margins highlight the challenging economics of the airline industry, where even small changes in costs or revenue can significantly impact profitability.
Cost Structure: Labor and Fuel Dominate ⛽👨✈️
American's $51.6B in operating expenses ↗️ (up 3.7% from 2023) breaks down as:
Salaries, Wages and Benefits: $16.0B (31.1%) ↗️ (up 9.9%)
New labor agreements significantly increased costs
87% of employees are covered by collective bargaining agreements
Aircraft Fuel: $11.4B (22.1%) ↘️ (down 6.8%)
Average fuel price decreased 12.2% to $2.60 per gallon
Fuel consumption increased 6.1% due to capacity growth
American does not hedge fuel, making it fully exposed to price fluctuations
Regional Expenses: $5.0B (9.8%) ↗️ (up 8.6%)
Costs for regional carrier operations
Maintenance: $3.8B (7.4%) ↗️ (up 16.2%)
Increased engine overhauls and airframe heavy checks
Other Costs: $15.4B (29.6%)
Including landing fees, aircraft rent, selling expenses, etc.
American's cost per available seat mile (CASM) was 17.61 cents ↘️ (down 1.7%), primarily due to lower fuel costs. However, CASM excluding special items and fuel was 13.50 cents ↗️ (up 2.6%), indicating underlying cost pressure.
Balance Sheet: Still Heavy But Improving 🏋️♂️
American has been focused on strengthening its balance sheet:
Total Debt and Finance Leases: $30.5B ↘️ (down from $32.9B at end of 2023)
Available Liquidity: $10.3B (including $7.0B in cash and short-term investments)
Debt Repayments: $4.5B in 2024 (including early debt reduction)
While American has made progress in debt reduction, it still carries substantially more debt than Delta or United, making it more vulnerable to economic downturns. It's like trying to run a marathon while wearing a weighted vest—possible, but certainly more challenging.
Capital Allocation: Fleet Modernization 🛩️
American's capital expenditures totaled $2.7B in 2024, primarily for:
Aircraft purchases and modifications
Engine acquisitions
Airport facility improvements
Future aircraft commitments total approximately $26.1B through 2029, including:
Airbus A320neo Family: 148 aircraft
Boeing 737 MAX Family: 152 aircraft
Boeing 787 Family: 30 aircraft
Embraer 175: 92 aircraft
These investments aim to improve fuel efficiency and customer experience but represent significant financial commitments that will require continued profitability or additional financing.
Layer 5: What Do We Have to Believe? 📚
The Bull Case 🐂
For American Airlines to outperform, you need to believe:
Debt Reduction Will Continue: American will further strengthen its balance sheet, reducing interest expenses and financial risk. The company paid down $4.5B in debt during 2024, showing commitment to this goal.
AAdvantage Will Keep Growing: The loyalty program will continue its strong performance, with the new Citibank agreement driving increased revenue from 2026 onward. This high-margin revenue stream is critical to overall profitability.
Capacity Discipline Will Improve Yields: The industry will maintain rational capacity growth, allowing American to improve passenger yields after the 4.7% decline in 2024.
Cost Control Efforts Will Succeed: American's "reengineering the business initiatives" will successfully control non-fuel costs, offsetting wage increases from new labor agreements.
Premium Travel Demand Will Remain Strong: Business and premium leisure travel will continue to be robust, supporting higher-yield traffic.
The Bear Case 🐻
Key risks to consider include:
High Debt Burden: Despite reduction efforts, American still carries $30.5B in debt and finance leases, making it vulnerable to economic downturns and interest rate increases.
Competitive Pressures: Intense competition from both legacy carriers and low-cost airlines could continue to pressure fares and yields.
Fuel Price Exposure: American has no fuel hedging program, making it fully exposed to fuel price fluctuations. A significant increase would directly impact profitability.
Labor Costs: New labor agreements have significantly increased costs, with salaries, wages and benefits up 9.9% in 2024. Future negotiations could further pressure the cost structure.
Economic Sensitivity: Air travel is highly sensitive to economic conditions. Any downturn would likely impact revenue and profitability significantly.
Metrics to Watch 👀
Keep an eye on these key indicators:
Passenger Yield: Has the 4.7% decline in 2024 reversed? Improving yields would signal pricing power.
Debt-to-EBITDA Ratio: Is American continuing to reduce its debt burden relative to earnings?
AAdvantage Revenue: Growth in loyalty program revenue is crucial to the overall investment thesis.
CASM ex-Fuel: Can American control non-fuel costs despite labor pressures?
Premium Cabin Load Factors: Strong premium demand is essential for profitability.
The Bottom Line ✍️
American Airlines operates in a challenging, cyclical industry with thin margins and high fixed costs. The company has made progress in strengthening its balance sheet and growing its valuable loyalty program, but still faces significant challenges from its debt burden, cost pressures, and intense competition.
The AAdvantage program remains the crown jewel of the business, generating substantial high-margin revenue that helps offset the challenging economics of the core airline operation. The new Citibank agreement should further enhance this valuable asset.
For investors, American represents a leveraged bet on continued strong travel demand and industry capacity discipline. The company will likely outperform during economic expansions but faces greater risks during downturns compared to less-leveraged competitors like Delta and United.
As Warren Buffett once quipped before he briefly invested in airlines: "If a farsighted capitalist had been present at Kitty Hawk, he would have done his successors a huge favor by shooting Orville down." While that's overly harsh, it captures the historically challenging economics of the airline industry. American's success depends on navigating these structural challenges while leveraging its network strength and loyalty program to generate sustainable returns through economic cycles.
Disclaimer: This guide is for informational purposes only and does not constitute financial advice, investment recommendations, or an offer or solicitation to buy or sell any securities. The information contained in this report has been obtained from sources believed to be reliable, but StrataFinance does not guarantee its accuracy, completeness, or timeliness.